Read the whole market before you trade.
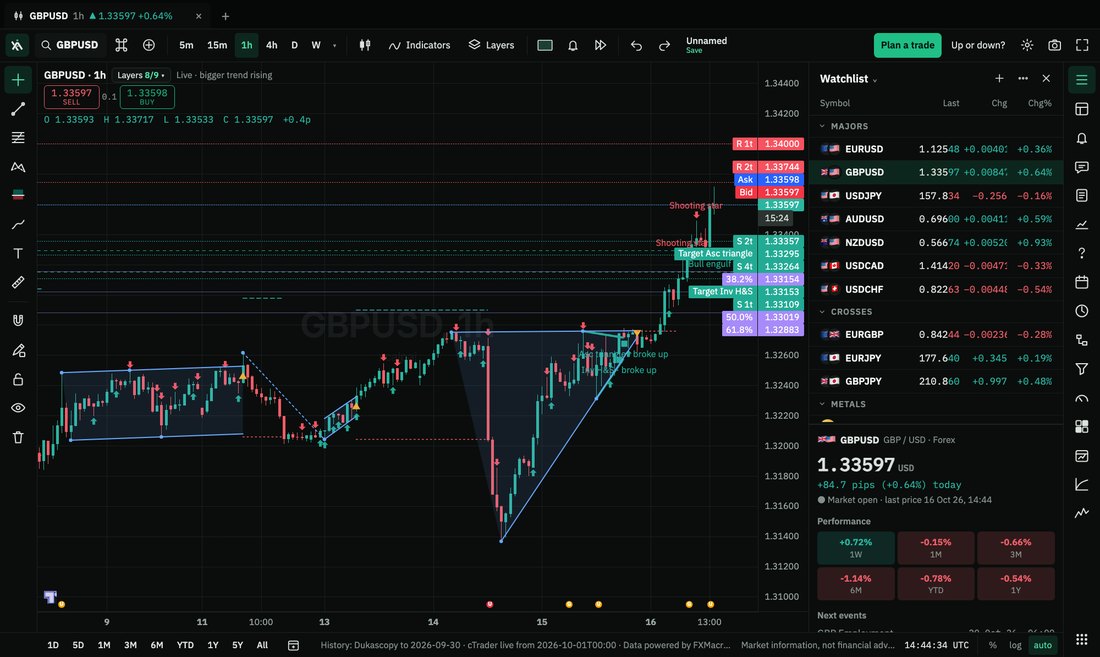
Charts, a plain-language briefing, odds measured on real history, the economic calendar, a trade planner and alerts, on one desk. XcalpAI shows you the evidence. You make the call.
Free account, no card. No signals, no forecasts.
- Resistance above. Levels like it held 48.1% of the time; random prices held 48.3%.
- US CPI in 1h 59m. High impact, with what this pair did after past releases.
- A 0.4-pip spread is 2% of this 20-pip stop. On a 4-pip stop it would be 10%.
- An alert on the trend line, checked on our servers every 2 seconds, app open or not.
We measured the classics. Most of them are coin flips.
Support and resistance, candlestick patterns, Fibonacci levels: each one checked against what a random price would have done. When there's no edge, XcalpAI says so on the chart.
No edge. So we print it, next to the level, every time.
That isn't a flaw in XcalpAI's levels. It's the honest base rate for a kind of level most charting tools call “strong”. Knowing it changes how much you risk on it.
- Sample
- 167,558 times price reached a listed level, from 664,000 briefings on the six major pairs, January 2022 to September 2026.
- Held means
- Price moved one hour-ATR away before one ATR through, within 24 hours.
- Random levels
- Made-up prices 0.5 to 1.5 ATR from each real level, put through the same test. Only data known at each moment was used.
Everything a trader checks, and nothing that decides for you.
Charts you already know how to use
Candles to point & figure, full indicator settings, layouts of up to 16 synced charts, compare overlays and tabs.
| Chart types | 17 |
|---|---|
| Indicators | 59 |
| Drawing tools | 67 |
| Charts per layout | 16 |
The briefing, written the way a colleague would
An example of the plain-language summary beside every chart.
GBP/USD · 09:41 London
The bigger trend is rising on the daily and four-hour charts, while the hour has turned down. Price has used 64% of its usual daily range.
The nearest level is above. Levels like it held 48.1% of the time; random prices, 48.3%. US CPI is due in under two hours.
The pound is the stronger of the two over the last day. London is open; New York opens in about four hours.
Know what's coming, and what it did last time
Times in your own time zone, importance, actual against prior, a countdown, and the pair's move in the 15 minutes after past releases.
| 12:30 | EUR · Retail sales | released | |
| 14:30 | USD · Consumer prices | 01:59:12 | |
| 16:00 | CAD · Housing starts | later |
Example rows. Calendar data powered by FXMacroData.
Alerts that keep watching after you close the app
Kept and checked on our servers every 2 seconds. Pop-up, sound, desktop notification or a webhook.
- EUR/USD crossing 1.1200Only once · until 13 NovActive
- RSI 14 on GBP/USD crossing 70Once per barActive
- GBP/USD entering the channelFollows the drawing when you move itActive
Practise on the past, without hindsight
Pick any moment, hide what came after, and step forward candle by candle at your own pace.
Do the arithmetic before the trade, not after.
Size, costs and reward to risk, with the working shown. Try it: drag the stop down and watch the spread start to matter.
Example: entry 1.32500, a pip worth $10 per lot, a 0.4-pip spread. In the app these come from the live market.
We tested the shortcuts. They failed. So we don't sell them.
- Signals
No buy or sell calls, and no copy trading. You decide, with the evidence in front of you.
- Forecasts
No “price will rise”, no promised win rate. Our direction models scored no better than chance, so we left them out.
- Autopilot
Nothing trades for you. You place trades with your own broker, when you choose.
- Advice
XcalpAI gives market information and tools. The decision is yours.
A real app for your desk, on Mac and Windows.
Native windows, tabs and keyboard shortcuts, and layouts that stay as you left them. Sign in with your XcalpAI account and your alerts follow you to every device.
What people ask first.
Does XcalpAI tell me when to buy or sell?
Which markets are covered?
Where do the prices and data come from?
Do I need a broker account?
Do alerts work when my computer is off?
How much does it cost?
Check before you trade.
A free account, no card. Your charts, alerts and layouts on every device you sign in on.